
How to Find Value Hiding in Your Operations

There is value hiding in your operations. The key to finding it, measuring it, and being able to take action to realize it is data mastery.

One of today’s most pressing needs is for manufacturers to realize how to gain real business value from the data generated by their Manufacturing 4.0 initiatives. As David R. Brousell, Co-Founder of the Manufacturing Leadership Council, said in his opening address at this year’s Rethink Conference, “The value that we will be able to generate from the digital model, whether that value is expressed in time, productivity, customer satisfaction, speed, or in hard dollars – will be determined by our ability to master data to not only improve what exists, but to also identify what might not yet exist – but could.”
One way to begin turning those possibilities into realities is to take a close look at your current operations to uncover hidden value.
Reality Doesn’t Always Adhere to the Plan
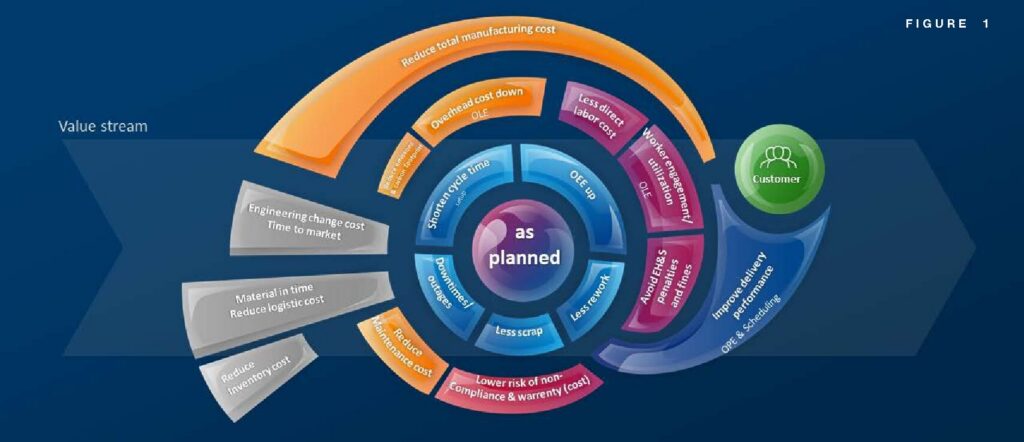
The Value Stream illustrates the various objectives and challenges manufacturers face in delivering products to their customers.
The goal of manufacturing is to produce according to a plan that considers available machine capacity, dependencies, and constraints, as well as available material and labor resources. It is based on a projection of customer demand and a balance of economic manufacturing quantities and inventory costs and space. An equivalent goal is customer satisfaction, with the objective of delivering to the customer on-time, in-full, without quality defects, and at a competitive price. (See Figure 1) But along the way, things may go not as planned, risking the ability to meet customer commitments.
As shown in Figure 2, deviations can be introduced right from the start — in this case, a setup step that begins late and takes longer than expected. And then, even before production begins, there is an undefined stoppage delaying production further. Once production does begin, manufacturing the first piece takes longer than expected. Then, there is technical stoppage, requiring maintenance resources, idling the production worker, and further delaying production. The process resumes, but the piece produced does not meet quality standards and must be scrapped. Delays are further compounded because now material is not at the workstation to produce a replacement piece. Finally, the second piece is produced, way beyond the planned timeframe, but now, with the production schedule disrupted, personnel and production equipment are idle and not providing value.
Produce as Planned
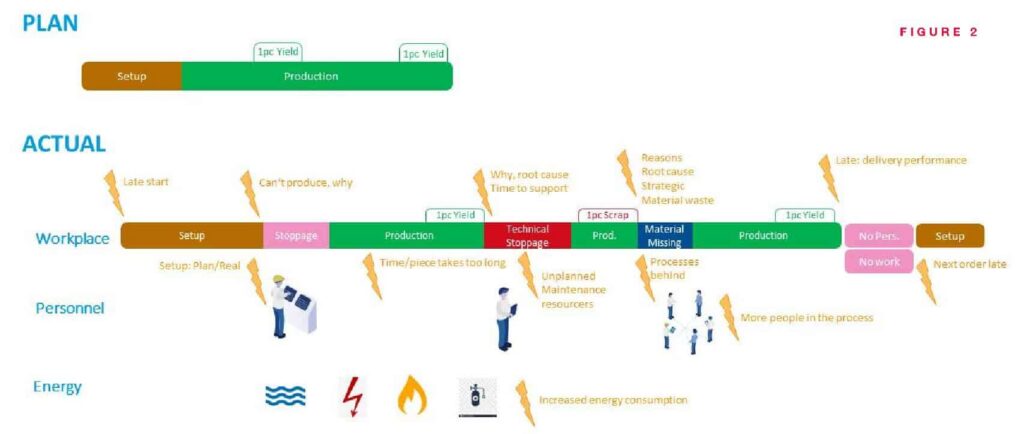
But why did these deviations occur? This is where data mastery comes in. The ability to collect data, analyze it, understand root causes, and translate it into meaningful actions is the key to finding the hidden value, or more correctly, it is what is keeping you from generating more value in your operations.
Let’s take the setup time issue as an example. In Figure 1, “Shorten cycle time setup” is shown in the upper left quadrant, surrounding “as planned.” Analyzing machine and operator data across production lines, plants, divisions, production workers and time, and examining deviations and variability in the data begins the process of insight. Is the deviation from standard more prevalent at certain plants? How much variability is there between different operators? Does it vary by the experience of the operator? Are there training issues? Are there tools missing for the setup process? Breaking down the setup data into finer steps, such as the time for preparing forms, downloading CNC programs, and calibrating machines can provide further insight. And finally – is the as-planned standard realistic? Taking all of this together, the factory can become more productive, more consistent, and more predictable – both for the setup process and for the subsequent process steps that follow.
It’s also important to seek opportunities to not only meet as planned targets, but also to continually improve — becoming more profitable, competitive, and resilient.
For example, while the overall costs to operate a plant are known, it can be challenging to calculate and reconcile those costs from a bottom-up perspective — adding up all the material, labor, and overhead costs from each process step. Most manufacturers use a standard-costing model in their ERP to calculate margins in production, which leaves room for improvement because it is based on averages. Bringing together machine, operator, and material data, and applying the cost to each for each production cycle, provides the basis for a true-cost analysis. Then calculating the costs for idle time, scrap, and downtime, for example, can help reveal where the greatest hidden value opportunities exist. Similarly, understanding the cycle times for each production run and what issues contributed to delays can reveal opportunities for improvement that can lead to meeting delivery dates, shortening production times, and reducing inventory costs.

Alex Gerrish is an Account Executive with FORCAM

.