
The Journey to Analytics Maturity
How can manufacturing organizations progress from descriptive to prescriptive analytics on their journey to data analytics maturity?

TAKEAWAYS:
● How the benefits from data analytics increase exponentially as organizations progress along the Analytics Maturity Curve.
● The importance of data governance and quality at every stage.
● Driving data analytics by combining IIoT with data from IT and OT systems.
In today’s business world, data is the currency that allows stakeholders to successfully exchange information. Operating without it is like flying blind. Understanding how to use the data that’s available is essential.
Data analysis is also a critical aspect in the creation of measurement metrics and performance indicators that align with business objectives. This involves a series of processes, including data collection, cleansing, definition, and processing. Nevertheless, the reliability of the insights generated ultimately depends on the quality of the underlying data. Data analysis is only as valuable as the data it’s based on, and despite advancements in technology, ensuring data quality remains a persistent challenge.
When organizations emphasize the value of data over gut instincts, they can optimize their understanding of business operations by leveraging data analytics to automate processes, reduce defects, and increase velocity. When doing so, they may move from describing the status of operations to predicting outcomes. As the process matures, they can even prescribe conditions to improve operations. Organizations can track their journey to improving analytics using an Analytics Maturity Curve.
This article explores how businesses can leverage data analytics to gain numerous benefits, with the advantages increasing exponentially as they advance along the Analytics Maturity Curve. It also underscores the importance of data governance and management at every stage of the analytics journey. Various use cases are also included to highlight how data analytics has proven invaluable in real-world scenarios, demonstrating the tangible benefits of a mature analytics program.
Definition and Operationalization
The Analytics Maturity Curve is a model that outlines the different stages of growth and development an organization undergoes as it improves its use of data and analytics to drive better business outcomes (Fig 1). While progressing along the curve doesn’t imply that one type of analytics is superior to another, it does indicate that businesses must focus on developing a solid foundation in descriptive and predictive analytics before moving on to prescriptive analytics.
Another essential aspect of operationalizing data analytics is recognizing that true data mastery lies at the point of data collection. Organizations should aim to make data analytics easily accessible from the top floor to the shop floor, ensuring that relevant insights are available to the appropriate personnel throughout the organization, from plant managers to CEOs.
The Analytics Maturity Curve involves several steps, starting with data collection from various sources like ERP, business systems, and Internet of Things (IoT). The collected data is then cleansed by removing errors, duplicates, and irrelevant entries. This clean data can be used for descriptive analytics, using visual reports with drill-down capabilities to understand past or present events, patterns, and trends.

Advanced Analytics in Industrial Organizations
Advanced analytics has become increasingly important in industrial organizations, with technology advancements driven by the collection and analysis of data from the industrial internet of things (IIoT). This technology has a range of applications, from monitoring assets and server uptime to improving product quality through the monitoring of measured variables. By leveraging IIoT platforms, manufacturers can collect time-series data and use rich drag-and-drop dashboards, along with cognitive automation and robotic process automation, to enable advanced analytics.
One example of advanced analytics is the development of AI modules in cognitive automation that combine hyper-automation with real-time data ingestion, analysis, and conversion into structured data. This approach reduces noise, makes correlations, finds root causes, detects anomalies, and provides intelligent analysis and automated actions.
Sophisticated algorithms can detect seasonality and identify anomalies, triggering a self-healing process to address issues as soon as they are detected.
Advanced analytics also benefits from a human-in-the-loop process to enable feedback through reinforcement learning. This approach reduces false positives and ensures that hyper parameter configurations are tuned to respond to changes and learn new patterns.
Use Cases in Manufacturing
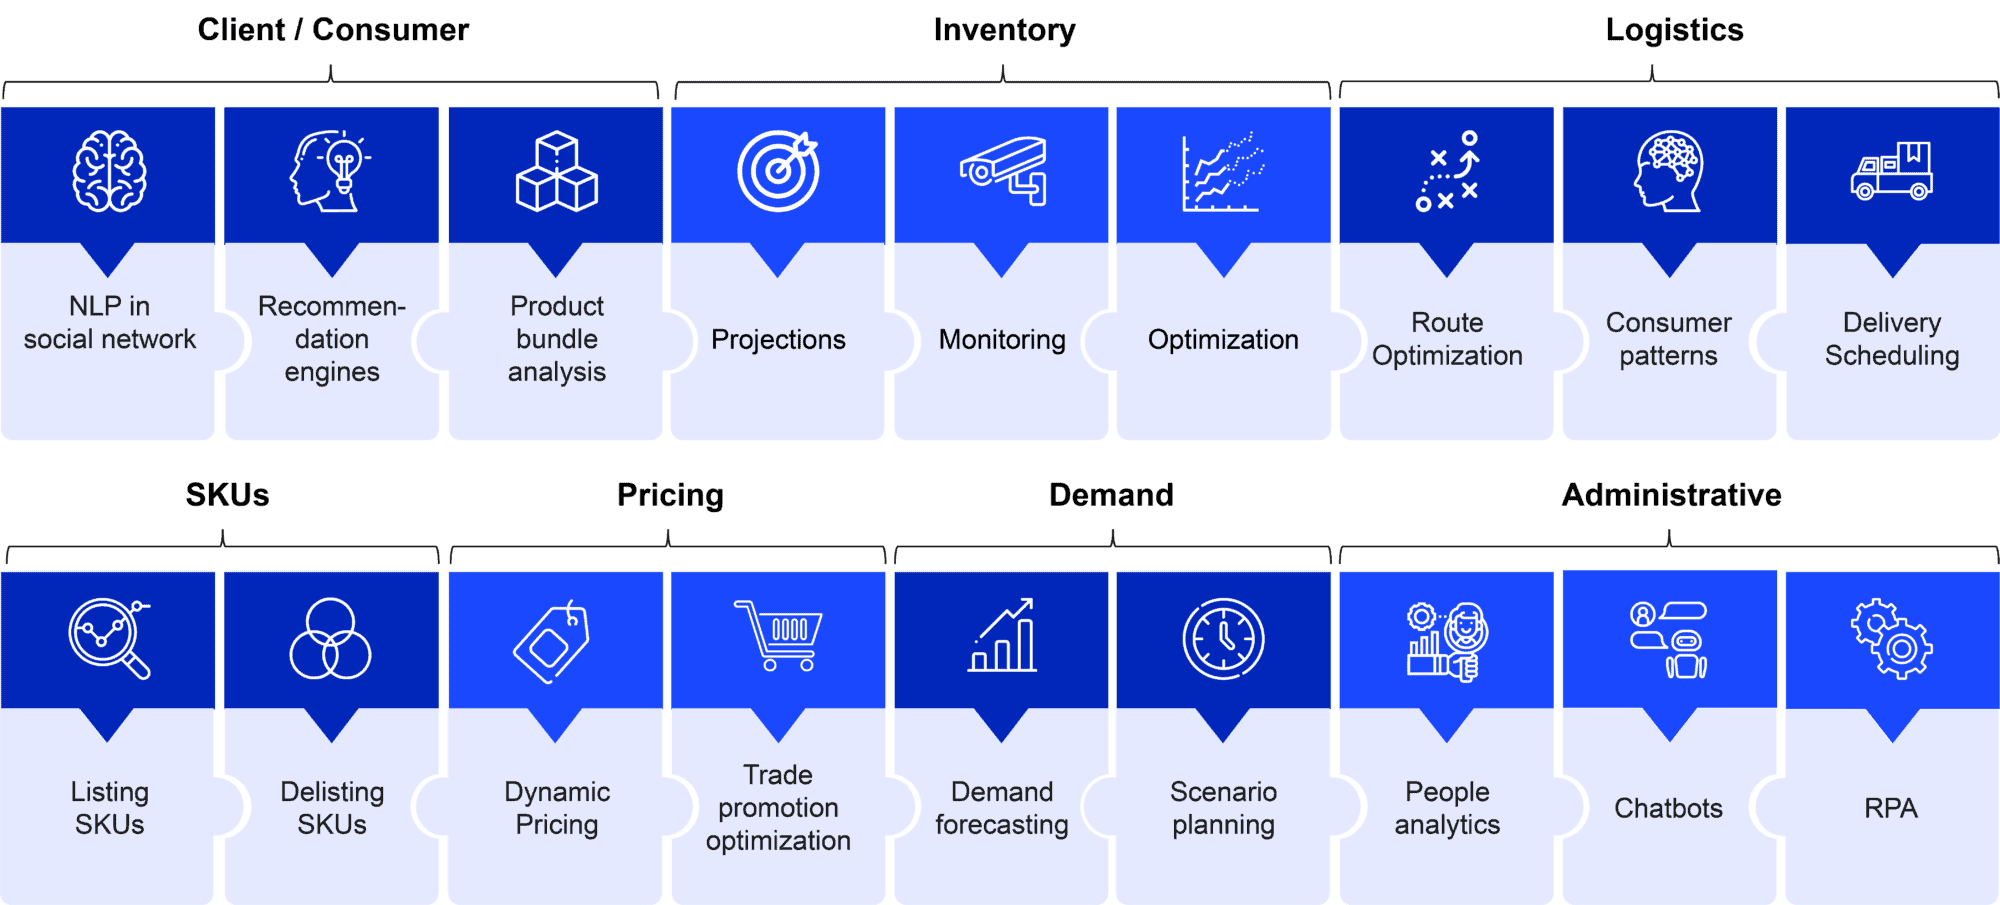
Product Life Cycle Management: Data analytics can be used to optimize the product mix of manufacturers by leveraging historical organizational data and market data. Optimization algorithms can predict market needs and identify new product offerings that meet those needs. Delisting underperforming products, strategic listing of underrepresented SKUs, simplifying the supply chain, and leveraging volumes in procurement can all lead to significant improvements in financial performance.
Inventory Optimization and Demand Management: Data models can predict inventory levels required to meet the desired product mix. The algorithms can be fine-tuned to optimize inventory by monitoring inventory levels and production, reducing changes in purchase order quantities, and providing a run-rate for production managers to consider for steady state operations. Demand can also be forecasted and optimized to improve cost and revenue influencers.
Client Sentiment and Resource Management: Advanced analytics tools such as natural language processing and sentiment analysis can be used to monitor social media messages, chatbot conversations, smart device interactions, and survey responses to understand client buying practices. These insights help manufacturers better understand and service customer requirements, as well as improve human relations and work conditions in an industrial environment.
Fig 3. Data Analytics Use Cases in Manufacturing
Source: Softtek
Next Level Benefits in Manufacturing
The manufacturing industry relies on metrics like cycle time, asset uptime, and work queues to plan workloads and machine operations. However, data analytics can take these efforts to the next level, helping reduce defects, improve quality, increase efficiency, and save time and costs. Some of the benefits include:
- Enhanced product quality and efficiency: Real-time data from multiple sources across the supply chain and factory, combined with machine learning and visualization tools, can deliver insights to optimize performance and production based on market demand.
- Cost reduction: Data analytics can help manufacturers reduce the amount of tests required to enhance product quality, resulting in cost savings. By designing targeted inspection plans based on the quality of lots shipped to customers, manufacturing costs can be decreased while improving quality.
- Improved supply chain management: As supply chains become more complex and generate a larger volume of data, effective data management frameworks like those defined by DAMA can help organizations manage and govern data effectively.
- Improved demand projection: Big data analytics can help determine and project the demand for a particular product, allowing companies to manufacture products based on forecasts provided by analytics tools and eliminate or reduce production downtime and losses.
- Machine-level traceability and compliance measurement: Manufacturing analytics software can improve asset management, increase asset lifetime, improve asset availability, and prevent unplanned downtimes. Data analytics can also improve assembly line efficiency through, for example, a pinpoint defect scan to eliminate defects and increase quality and productivity.
- Customer satisfaction: By tracking products after sale, manufacturers can understand customer responses and reduce condition-based monitoring. Big data analytics can help avoid recall issues, ultimately leading to increased customer satisfaction and product and brand reputation.
Measuring Progress
To maximize the benefits of data analytics, organizations must carefully design their data management and governance framework and align functional metrics and KPIs with their objectives. After all, “What doesn’t get measured, doesn’t improve.” Measuring with intent is essential. Ultimately, data mastery and analytics require a clear understanding of business objectives and how to leverage data insights to achieve them.
About the authors:
Krishnan Venkat is Director of Supply Chain Consulting at Softtek.

Gonzalo Martín Vargas is Advanced Analytics Global Offer Manager at Softtek.